Why Pebble Beach and Carmel West Are Outpacing the National Market in 2026
We plan to cover a lot in this update, so here is the short version: nationally, 2026 is a story of modest sales growth and flat to softening prices. On the Monterey Peninsula overall, the same story holds. But in Pebble Beach and on Carmel’s west side, prices are moving up meaningfully, even as the broader market cools.
The national backdrop
Four data points from Altos Research and Compass frame where the country stands at midyear:
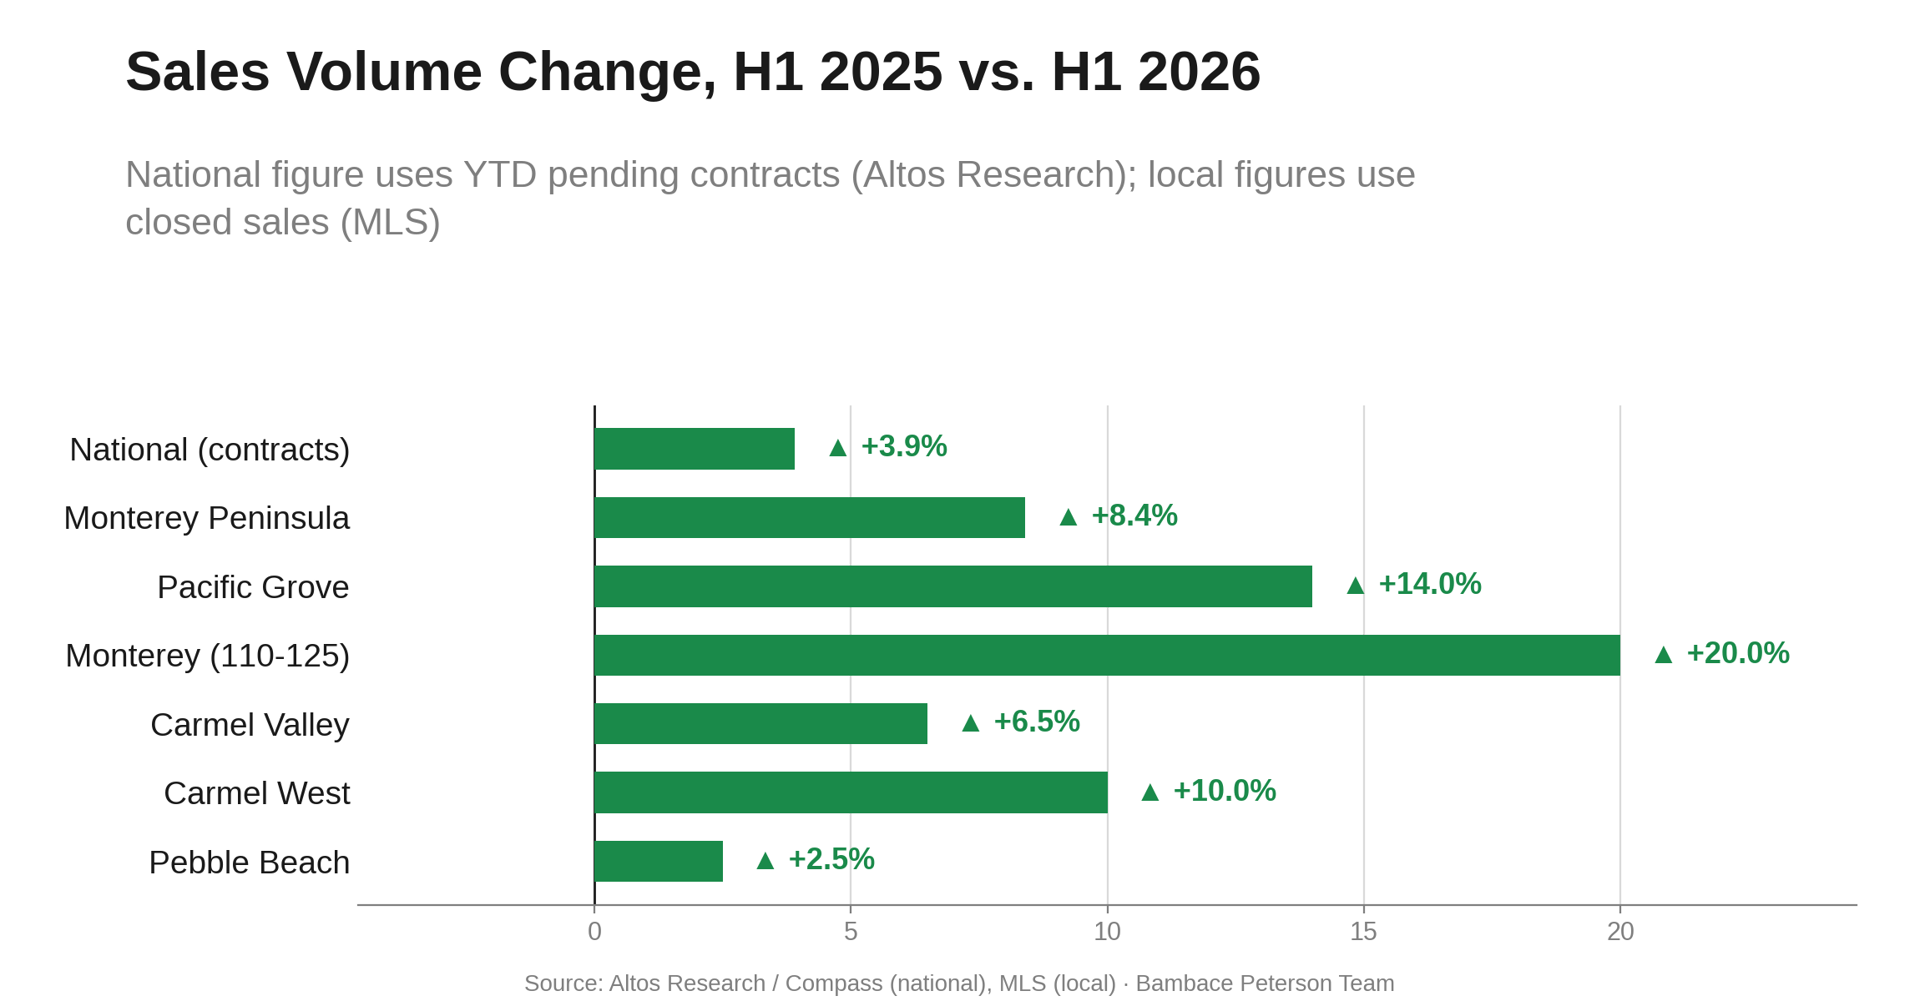
1. Sales are up, modestly. Pending home sales finished June about 5% ahead of a year ago. Year to date, there have been 3.9% more contracts signed than in the first half of 2025.
2. Inventory growth has stopped. After four straight years of rising inventory, unsold homes nationally are now flat year over year at 1.09 million. That said, inventory remains 15% below 2017 levels, so “flat” still means a tight market by pre-pandemic standards.
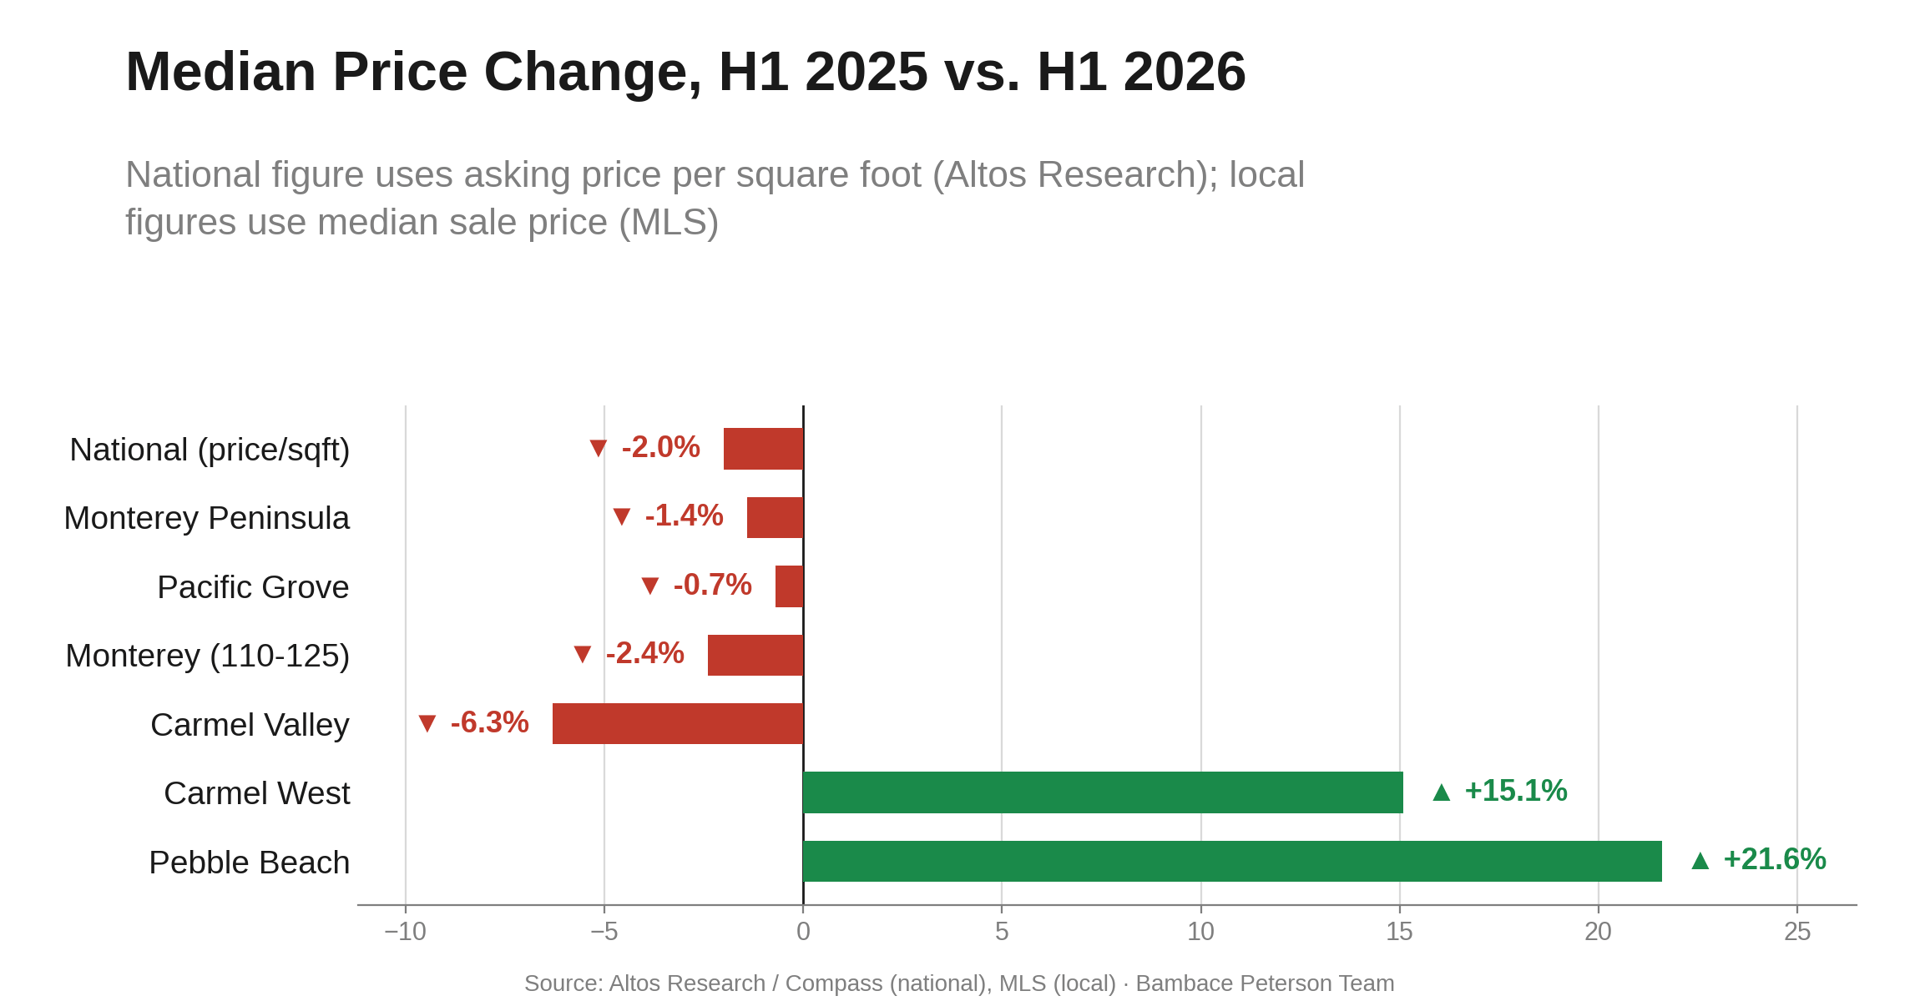
3. Prices are softening. Asking price per square foot nationally sits at $217, about 2% below the same point in 2025, and just under 2024 as well.
4. Price cuts are elevated. As of June 26, 39.5% of active listings nationwide had taken a price reduction from their original list price. Price reductions are a leading indicator, typically showing up in closed sale prices three to six months later. If that pattern holds, price pressure nationally continues into the fall.
Put together: more buyers active, more competition among sellers, and prices that are flat to softening.
The Monterey Peninsula, broadly
The Peninsula as a whole tracks the national pattern closely. Closed sales across the Peninsula rose 8.4% in the first half of 2026, from 298 to 323 transactions, a stronger pace than the country overall. But the median sale price slipped slightly, from $2,027,500 to $2,000,000, a decline of about 1.4%. More activity, essentially flat pricing. That is the national story, just with a bit more volume behind it.
Where it changes: Pebble Beach and Carmel West
That said, the top of the Peninsula market is not behaving like the rest of the country, or even like the rest of the Peninsula.
Pebble Beach: 40 sales in H1 2025 became 41 in H1 2026, essentially flat volume. But the median sale price rose from $2,795,000 to $3,400,000, up 21.6%.
Carmel West: Sales rose 10%, from 60 to 66 closings. The median sale price rose 15.1%, from $2,972,500 to $3,422,500.
In both submarkets, buyers are paying meaningfully more for the same or a similar number of homes changing hands. That is a different market than the one described by the national charts.
For what it’s worth, the sample size is smaller here than nationally. Forty to 66 annual sales is a small enough number that a handful of exceptional closings can move a median. We would not build a forecast on one quarter of this data. But we now have two consecutive quarters (2026-Q1 and 2026-Q2) showing the same direction in two different submarkets, which is a real signal worth paying attention to, not a fluke.
Checking it against the rest of the Peninsula
Before we called this a genuine luxury story rather than a Pebble Beach or Carmel West quirk, we ran the same comparison against Pacific Grove, Monterey (the 110-125 MLS area), and Carmel Valley.
Pacific Grove: Sales up 14% (57 to 65). Median price essentially flat, down 0.7% ($1,470,000 to $1,460,000).
Monterey (110-125): Sales up 20% (55 to 66). Median price down 2.4% ($1,198,000 to $1,168,750).
Carmel Valley: Sales up 6.5% (31 to 33). Median price down 6.3% ($1,750,000 to $1,640,000).
All three track the national and Peninsula-wide pattern: more sales, flat to falling prices. That is useful confirmation. The price appreciation in Pebble Beach and Carmel West is not a peninsula-wide phenomenon. It is specific to those two submarkets.
The cash buyer signal
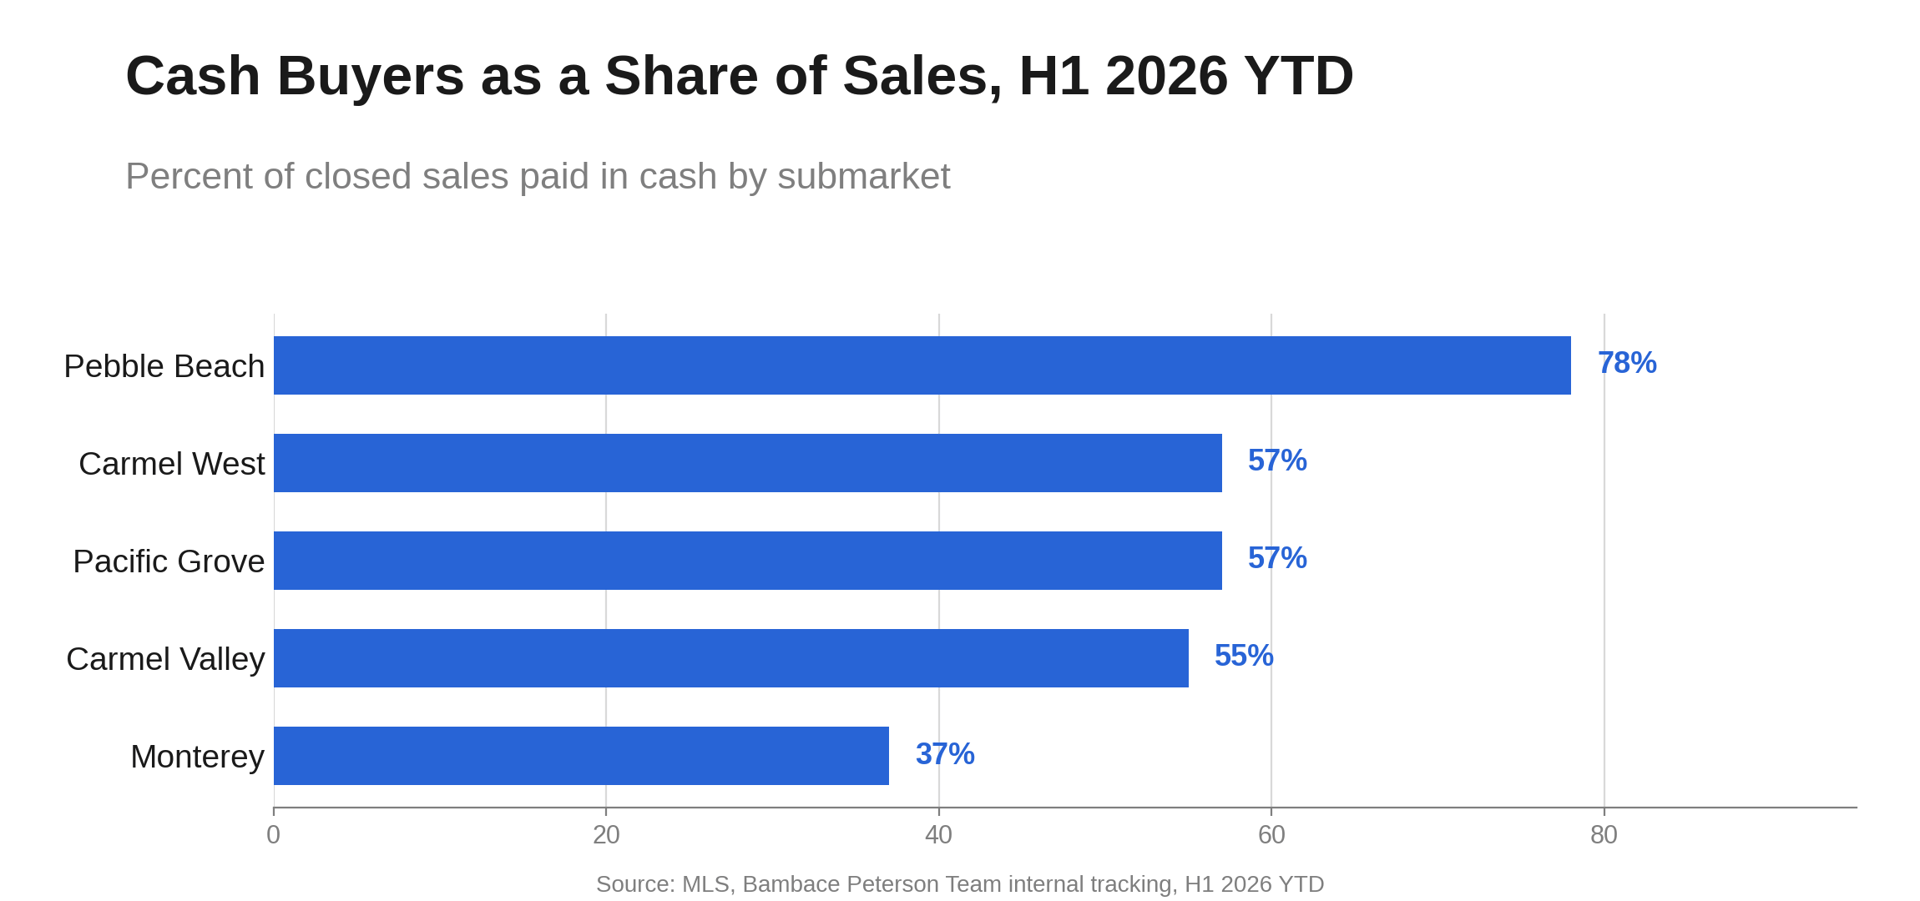
One more data point worth flagging: cash buyers. Across our submarkets, cash continues to represent a high share of sales this year: Pebble Beach (78%), Carmel West (57%), Pacific Grove (57%), Carmel Valley (55%), and Monterey (37%). That is consistent with the cash buyer trend we have tracked in our annual report for the past four years.
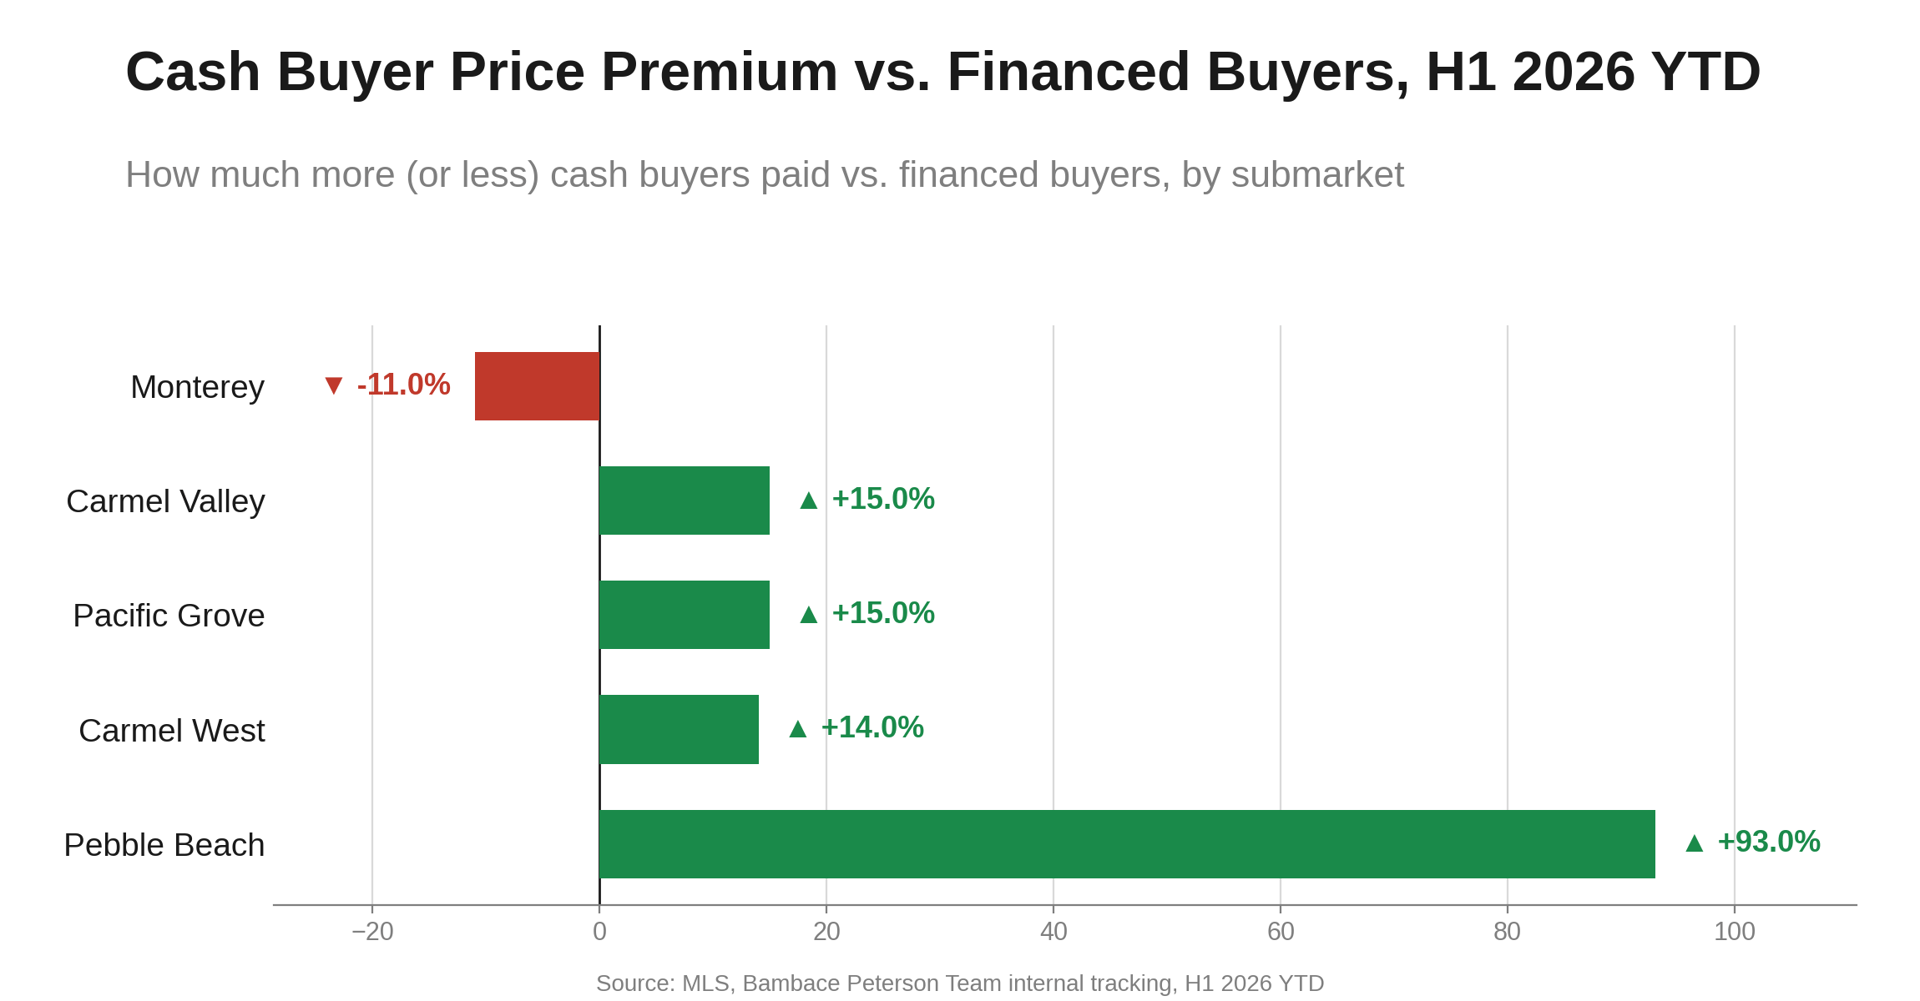
The price point of where the cash buyers are is meaningfully more in the luxury submarkets: 93% higher price points in Pebble Beach, 14% higher in Carmel West, and 15% higher in both Pacific Grove and Carmel Valley. Monterey is the exception, where cash buyers are purchasing 11% lower than the median price, a sign of more primary-home buyers rather than second-home or investment purchases.
Put together with the sales and price data above, this points to the same story from another angle: the luxury end of the Peninsula, led by cash buyers with less rate sensitivity, is where the real price strength lives right now.
What this means if you are buying or selling
If you own in Pebble Beach or Carmel West and have been waiting for the “right time,” the data says the right buyers are still very much in the market for the right homes. If you are house hunting in that price range, expect real competition, even while headlines describe a national market that is cooling.
If your search or your home is outside those two submarkets, the more cautious national and Peninsula-wide numbers are probably the better guide.
We are happy to run this same analysis for your specific street or property type. Reach out any time.
FAQ
Is the Monterey Peninsula luxury market outperforming the national market in 2026?
In Pebble Beach and on Carmel’s west side, yes, based on H1 2026 median sale price data. The broader Monterey Peninsula and the nation as a whole are seeing modest sales growth with flat to slightly declining prices.
Why are Pebble Beach and Carmel West prices rising while national prices are flat?
The data does not tell us why, only what. Likely factors include limited high-end inventory and buyer demand concentrated in top-tier addresses, but we would want more data before asserting a specific cause.
How reliable is this data given the small number of sales?
Pebble Beach and Carmel West each see roughly 40 to 66 sales a year, so individual months can be noisy. We look for the trend to hold across multiple quarters before treating it as durable, which it has for two quarters running.
What role are cash buyers playing?
A large one, especially in Pebble Beach, where 78% of sales this year were all cash and cash buyers are purchasing homes that are in a 93% higher than financed buyers. That is consistent with the pattern we have tracked in our annual report for the last four years.